


 Hide All
You can create a report using a recursive hierarchy and the Level function to show parent-child relationships in data. This walkthrough illustrates how to create a recursive hierarchy report.
The walkthrough is split into the following activities:
- Adding an ActiveReport to a Visual Studio project
- Connecting the report to a data source
- Creating a dataset to populate the parameter values
- Adding a report parameter
- Adding a dataset for the report
- Adding controls to the report to contain data
- Setting up a recursive hierarchy
- Using the Level function to display the hierarchy
- Viewing the report
 |
Note: This walkthrough uses the Store table from the Reels database. By default, in ActiveReports Developer, the Reels.mdb file is located in the [User Documents folder]\ComponentOne Samples\ActiveReports Developer 7\Samples\Data folder. |
When you complete this walkthrough you get a layout that looks similar to the following at design time and at runtime.
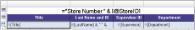
Design Time Layout


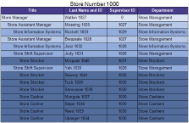
Runtime Layout
 To add an ActiveReport to the Visual Studio project
- Create a new Visual Studio project.
- From the Project menu, select Add New Item.
- In the Add New Item dialog that appears, select ActiveReports 7 Page Report and in the Name field, rename the file as rptRecursiveHierarchy.
- Click the Add button to open a new fixed page report in the designer.
See Adding an ActiveReport to a Project for information on adding different report layouts.
To connect the report to a data source
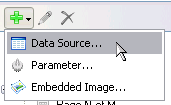
- In the Report Explorer, right-click the Data Sources node and select the Add Data Source option or select Data Source from the Add button.
- In the Report Data Source Dialog that appears, select the General page and in the Name field, enter a name like ReportData.
- On this page, create a connection to the Reels database. See Connect to a Data Source for information on connecting to a data source.
To create a dataset to populate the parameter values
- In the Report Explorer, right-click the data source node and select the Add Data Set option or select Data Set from the Add button.
- In the DataSet Dialog that appears, select the General page and enter the name of the dataset as Stores. This name appears as a child node to the data source icon in the Report Explorer.
- On the Query page of this dialog, in the Query field enter the following SQL query.
SQL Query  Copy Code
SELECT StoreID FROM Store
- Click the Validate DataSet icon at the top right hand corner above the Query box to validate the query.

- Click OK to close the dialog. Your data set and queried fields appear as nodes in the Report Explorer.
- In the Report Explorer, right-click the data source node and select the Parameters node or select Parameter from the Add button.
- In the Report - Parameters dialog that appears, set the following values:
In the General tab
- Name: StoreID
- DataType: Integer
- Text for prompting users for a value: Select a store number
In the Available Values tab select From query
- Dataset: Stores
- Value: StoreID
- Label: StoreID
- Click OK to close the dialog and add the parameter under the Parameters node of the Report Explorer.
To add a dataset for the report
- In the Report Explorer, right-click the data source node and select the Add Data Set option.
- In the DataSet Dialog that appears, select the General page and enter the name of the dataset as Employees. This name appears as a child node to the data source icon in the Report Explorer.
- On the Parameters page, add a parameter with the following properties.
- Parameter Name: @StoreID
- Value: =Parameters!StoreID.Value
- On the Query page of this dialog, change the Command Type to StoredProcedure and enter the following stored procedure into the Query text box (the question mark denotes the parameter)
EmployeesForStore ?
StoredProcedure Query Copy CodeEmployeesForStore ? - Click the Validate icon to validate the query and to populate the Fields list.
- Click OK to close the dialog. Your data set and queried fields appear as nodes in the Report Explorer.
To create a layout for the report
- From the toolbox, drag a Table control onto the body of the report and go to the Properties window to set the following properties.
Property Name Property Value Location 0in, 0in DataSetName Employees FixedSize (only for FPL reports) 6.5in, 9in - Click inside the table to display the row and column handles along the left and top edges of the table.
- Select the columns by clicking the grey column header above the column and change the Width property in the order as follows.
Column Property Name Second Column Width: 1.5in Third Column Width: 1.05in First Column Width: 2.2in - Right-click the grey column header above the third column and select Insert Column to the Right.
- Select the fourth column and change its Width property to 1.75in.

Tip: Making some columns narrower before adding columns or making other columns wider prevents your report width from changing. - In the Report Explorer from the Employees dataset, drag the following fields onto the detail row of the table.
Data Field Column Name Title TableColumn1 LastName TableColumn2 Supervisor TableColumn3 Department TableColumn4 - Select the LastName field in the second column of the detail row and in the Properties window, set the Value property to =Fields!LastName.Value & " " & Fields!EmployeeID.Value. This will display the Employee ID number along with each employee's last name.
- Select the static label in the second column of the detail row of the table and in the properties window, set its Value property to Last Name and ID.
- Select the Supervisor field in the third column of the detail row and in the Properties window, set its TextAlign property to Center.
- Select the static label in the third column of the detail row and in the Properties window, set its Value property to Supervisor ID.
- Select the header row by clicking the table handle to the left of the row and in the Properties window, set the following properties.
Property Name Property Value TextAlign Center FontWeight Bold BackgroundColor DarkSlateBlue Color White - Select the detail row and in the Properties window, set the BorderStyle property to Solid.
- Right-click the table handle to the left of the header row and select Insert Row Above.
- While holding down the SHIFT key, click each of the cells in the newly added top row.
- Right-click inside the selected cells and select Merge Cells to create a cell that spans the table.
- Go to the Properties window to set the following properties.
Property Name Property Value TextAlign Center FontSize 14pt Value ="Store Number " & Parameters!StoreID.Value - Right-click the table handle to the left of the row and select Table Footer to remove the footer row from the table.
- Select the detail row and in the Properties window, set the BorderStyle property to Solid.
|
Note: In case you are setting a recursive hierarchy on a Fixed Page Layout, set the DataSetName property in the FixedPage Dialog to Employees. |
To set up a recursive hierarchy
- Right-click the table handle to the left of the Detail row and select Edit Group to open the Table-Detail Grouping dialog.
- Under Group on: Expression, select =Fields!EmployeeID.Value.
- Under Parent group:, select =Fields!Supervisor.Value.
- Click OK to close the dialog.
To use the Level function to display the hierarchy
- Select the cell in the first column of the Detail row that reads =Fields!Title.Value and in the Properties window, expand the Padding property.
- In the Padding > Left property, enter the expression =2 + (Level() * 15) & "pt".
Note: Adding 2 to the result ensures that a normal amount of padding is always used.
To use the Level function with themes in the BackgroundColor property of a textbox
- Go to [User Documents folder]\ComponentOne Samples\ActiveReports Developer 7\Page Reports\CPL\Layouts\Reports\Reels.
Note: In Windows Vista, the path is [User Documents folder]\ComponentOne Samples\ActiveReports Developer 7\Page Reports\CPL\Layouts\Reports\Reels. - Copy the file Reels.rdlx-theme and paste it into the folder in which you saved your report.
- In the Report Explorer, select Report.
- In the Properties window in the Theme property, enter the theme file name: Reels.rdlx-theme.
- Click the table handle to the left of the detail row to select the entire row.
- In the Properties window, set the BackgroundColor property to =Theme.Colors(Level() + 1, 4).
- Click the preview tab to view the report at design time.
OR
- Open the report in the Viewer. See Using the Viewer for further information.
 See Also
Concepts
Expressions